
 281
281
NOTE: The “Monitoring” menus will appear only for the product Getac Monitoring.
Expand Monitoring and select Alert. This page shows the number of devices that are diagnosed as having potential problems. You can select a problem category to check the details.
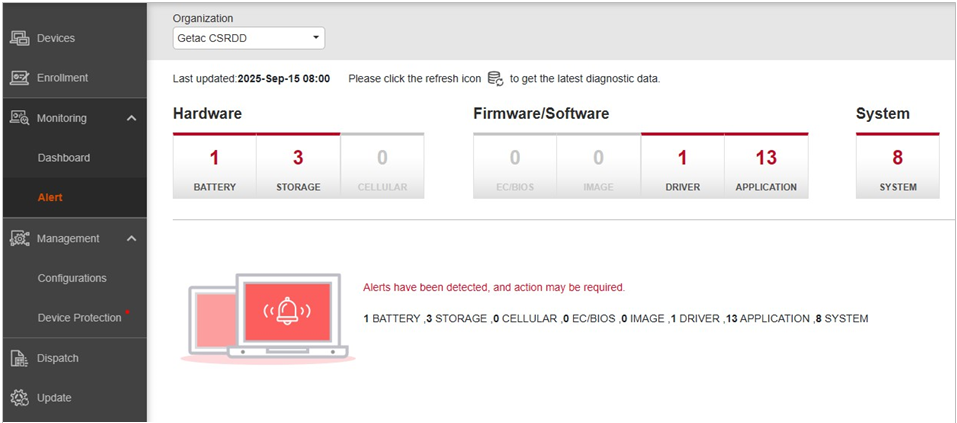
Getac Monitoring automatically collects data from the client devices and conducts data analysis according to the preset threshold values. When a device component reaches the threshold, it will be added to the alert list.
NOTE: You can change the individual threshold values according to your corporate policy or preferences.
![]() You can click the Refresh button to refresh the data.
You can click the Refresh button to refresh the data.
Viewing Alert Details
On the Alert page, click a category to view the list of devices which reach the threshold.
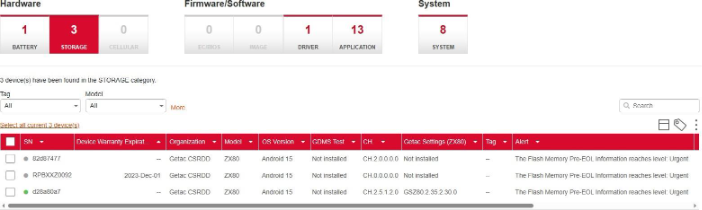
You can perform several actions with the device list.

