301
301
NOTE: The “Monitoring” menus will appear only for the product Getac Monitoring.
Expand Monitoring and select Dashboard. The dashboard presents data in graphs and charts. You get statistical data of the client devices at a glance.
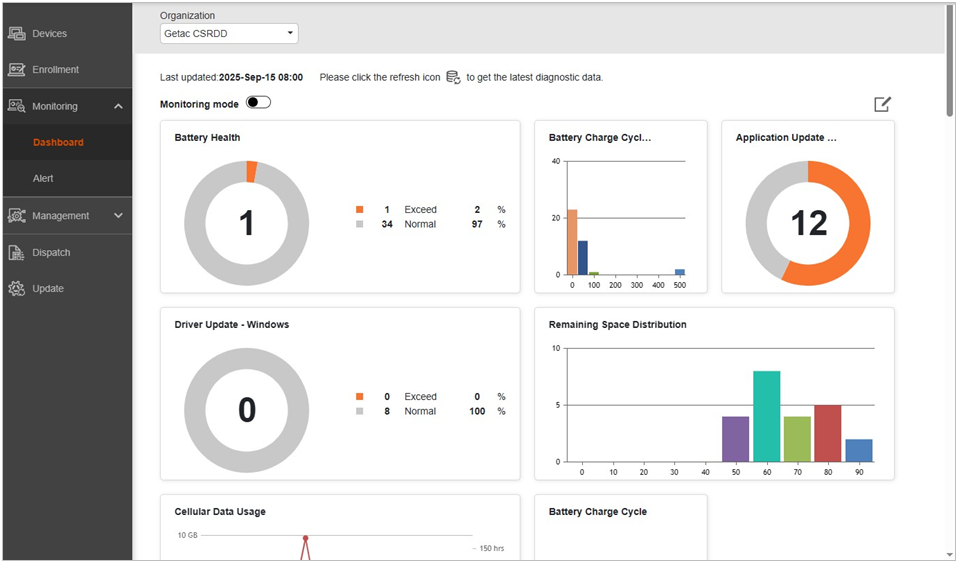
The dashboard is empty when you access this page for the very first time. Choose the data to be displayed as described in the following section.
Choosing Data to be Displayed
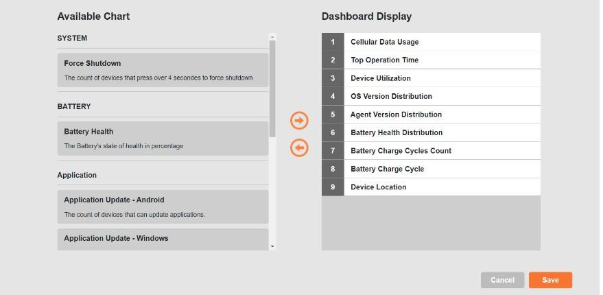
You can determine what charts to be displayed in the dashboard.
NOTE: This action can be performed only if the user account is allowed to.
-
Click the Edit button
 at the upper right corner of the Dashboard
page.
The “Dashboard Display” column at the right side lists the items that will be shown in the dashboard.
The “Available Chart” column at the left side lists the available items. They include items you have previously removed from the right-side list and items you have added via the Alert Threshold settings page.
-
To add an item to the dashboard, select it in the left column and click
 .
.
To remove an item from the dashboard, select it in the right column and click ![]() .
.
-
After making changes, click Save.
Viewing Dashboard Data
Refresh
You can click the Refresh button ![]() to refresh the data.
to refresh the data.
In Full Screen
![]()
To view the dashboard in full screen, click the Monitoring mode switch to change it to the “on” position.
If you exit full-screen mode by way of Windows (using the Esc key, for example), the Dashboard data area will fully occupy the web browser interface, with the browser title bar and Windows taskbar (if not hidden) visible.
NOTE: When Monitoring mode is on, you will remain logged in. You can log out only after switching off the Monitoring mode.
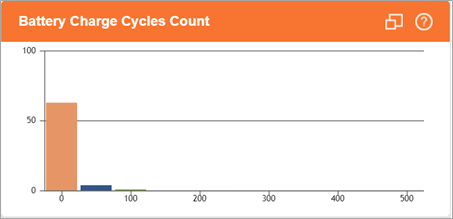
Viewing Charts
When you hover over the title bar of a chart, the title bar will become highlighted and display two buttons.
-
 This button provides a brief description of the chart.
-
 This button allows you to switch the chart size between small and large. With a small size, you can have more charts displayed in one screen.
-
You can move a chart by clicking-and-holding its title bar and then dragging to a different position.
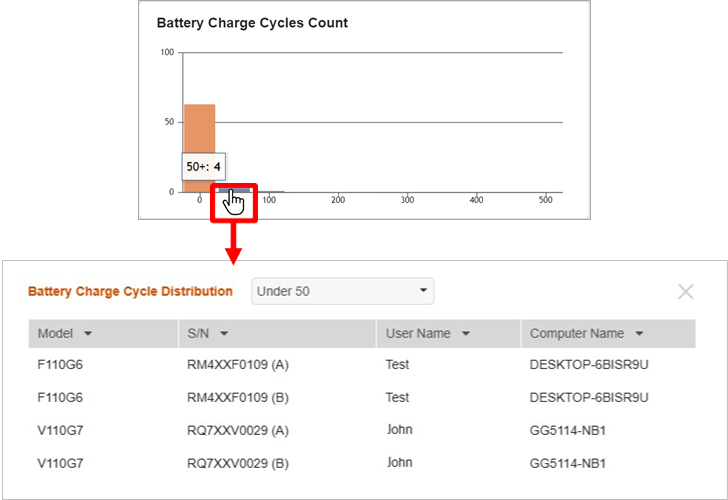
Drilling Down into the Data
When you hover over a chart and the mouse cursor turns into a hand icon (with or without a pop-up data box), it means you can click to view the related device list.